Overview
Understand organisation-wide figures, trends and production comparisons
The BI Dashboard consolidates the business-intelligence data recorded in projects into an organisation-wide steering view. While the regular Dashboard shows today's personal work, the BI Dashboard answers questions such as:
- How many visitors, how much revenue and how many performances were recorded?
- How are visitor numbers and revenue developing compared with the previous year?
- Which sectors or production categories contribute to the results?
- Which productions show a notable relationship between effort and output?
- Where are BI figures still missing?
The menu item is only visible when the BI module is enabled and your account has the permission View BI dashboard. The buttons Excel-Export, Budget export and Export table only appear with the permission Export BI data, which includes viewing the dashboard.
Structure: Overview and Steering
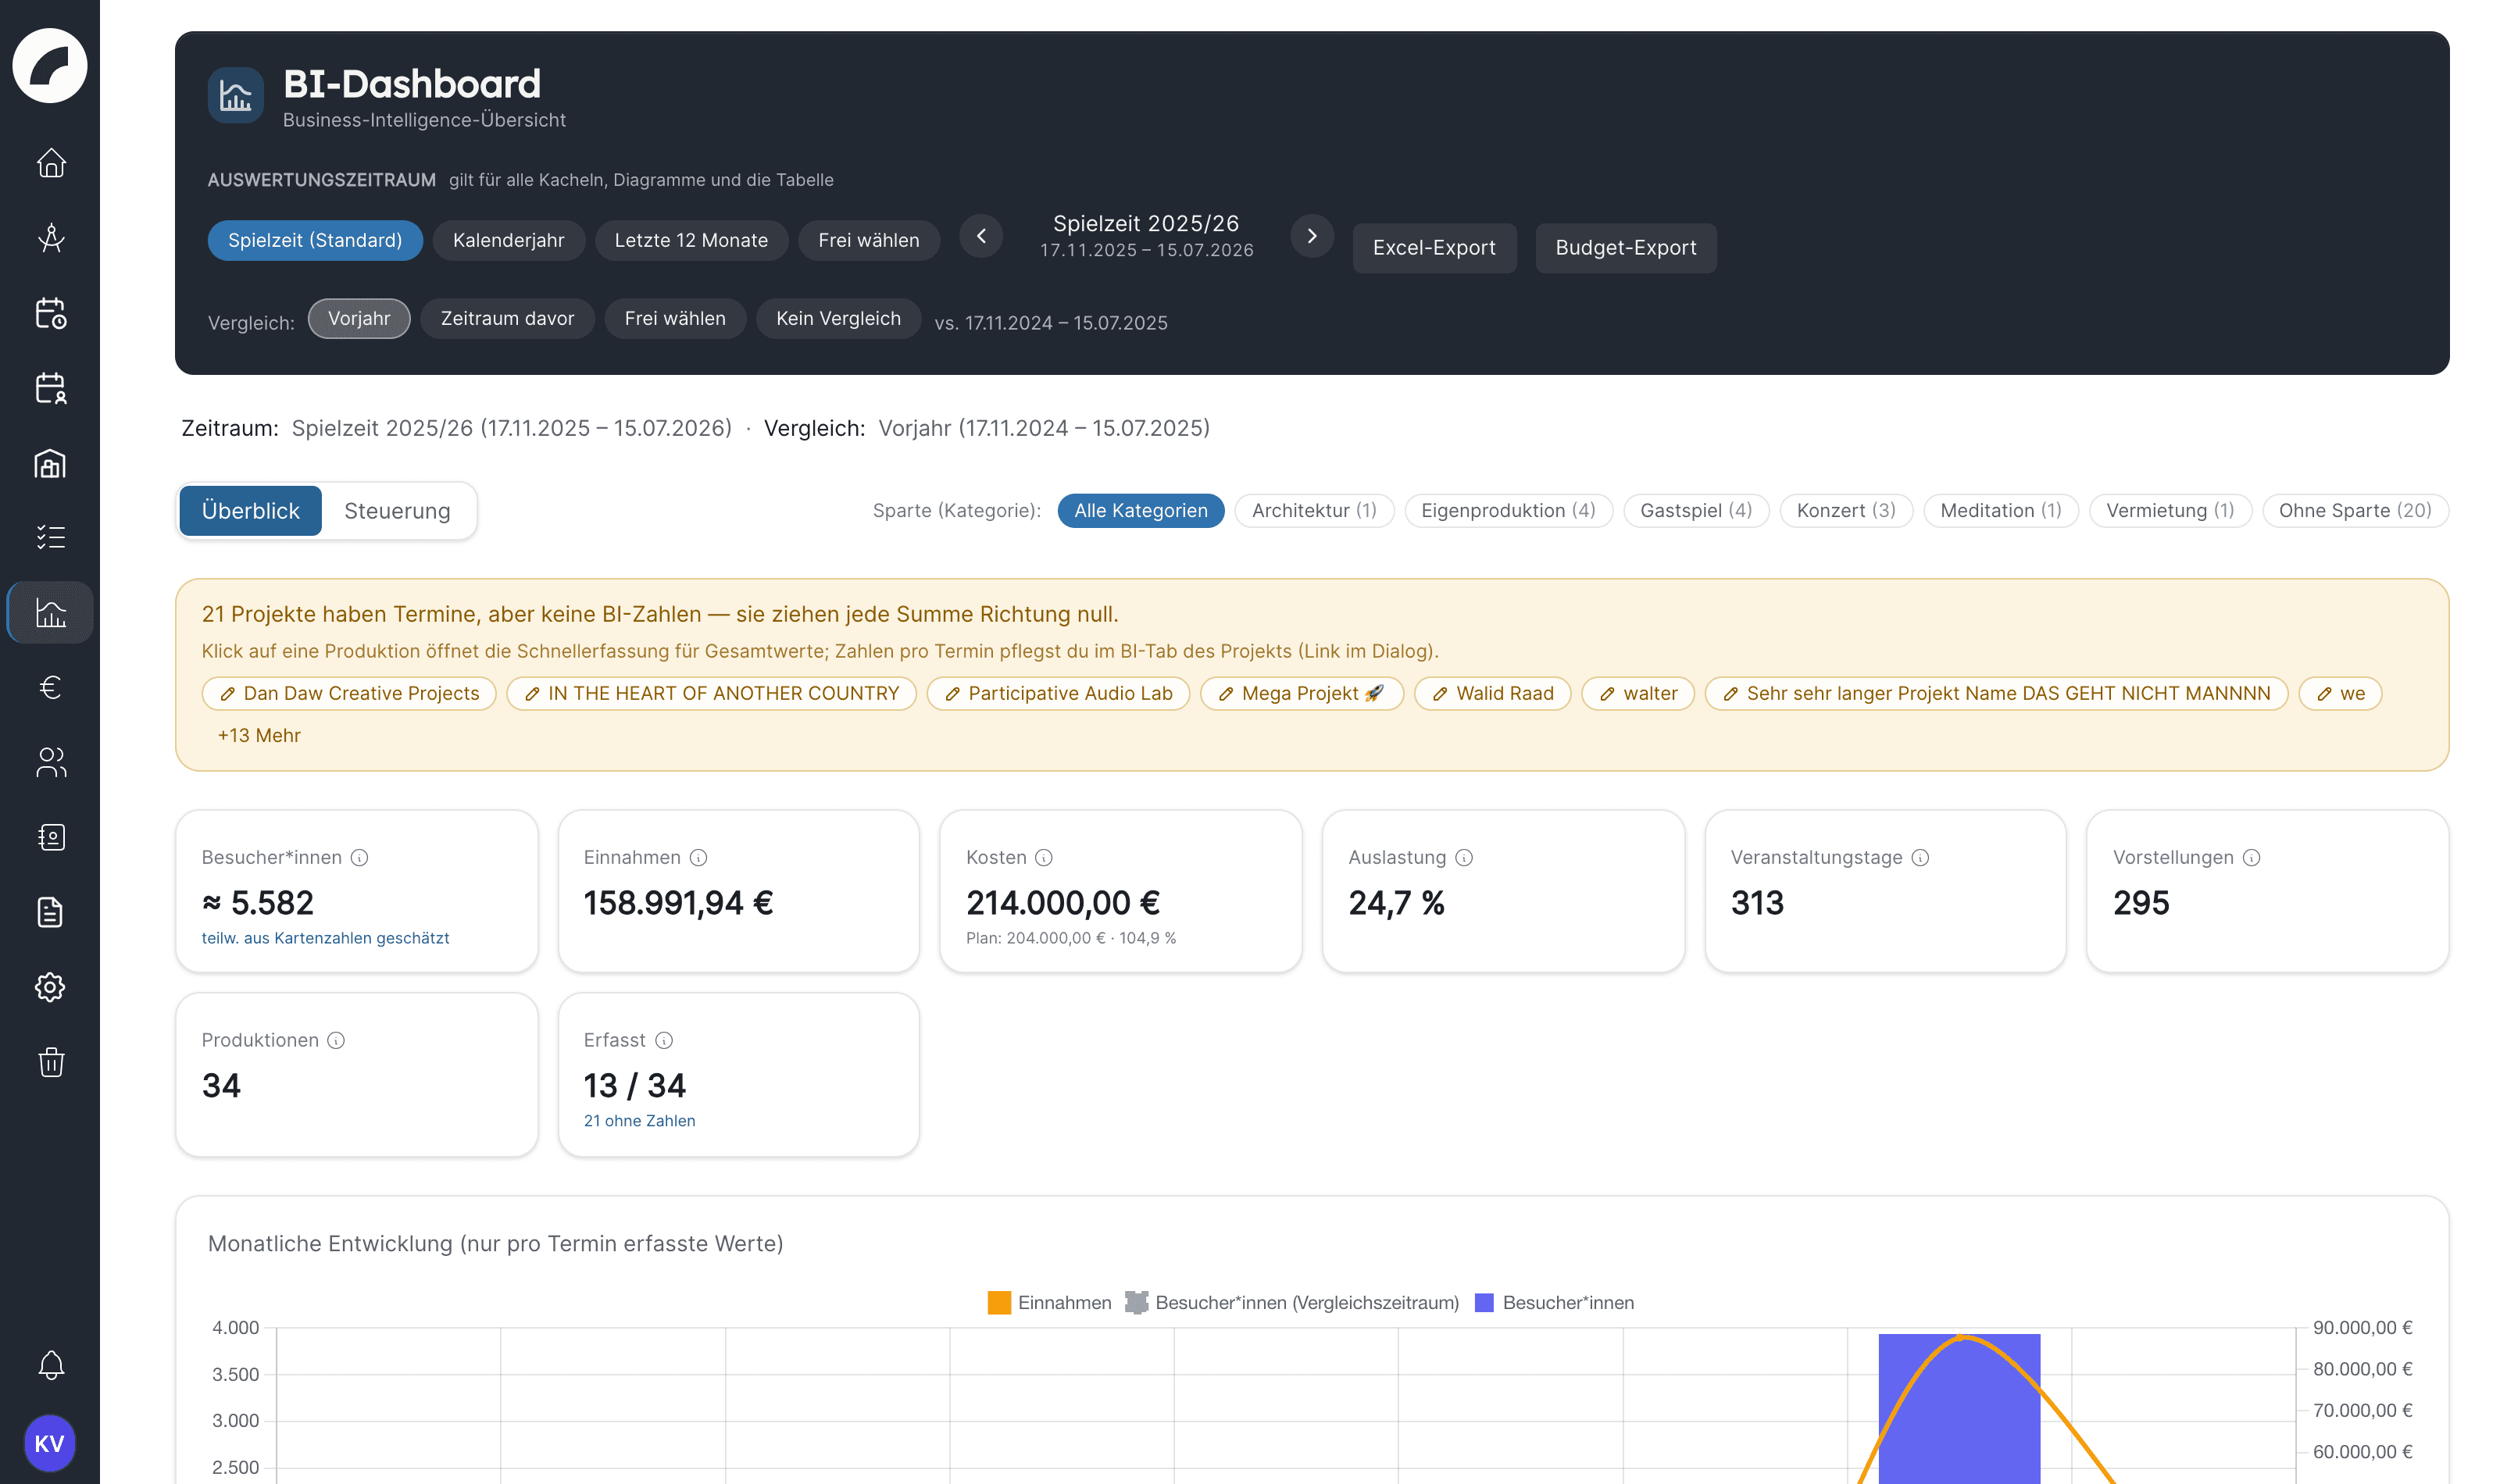
The dashboard has two views that you switch at the top:
| View | Content |
|---|---|
| Overview | KPI tiles, data-gap notices, monthly trend, revenue and visitors by category |
| Steering | Effort vs. output and the production table |
Below the header, one sentence states which evaluation period currently applies — it affects all tiles, charts and the table. The category filter is a real page filter: clicking a category filters the whole dashboard, not just the table. Excel-Export opens the shared BI export dialog, prefilled with the dashboard period. Next to it is the budget export.
Selecting a period
By default, Artwork uses the season window defined in the tool settings under Communication & Legal. If no season or an invalid one is configured, the dashboard uses the current calendar year and shows a notice with the link Set season window. Alternatively, you can use these presets:
| Selection | Effect |
|---|---|
| Season (default) | Uses the centrally configured season start and end |
| Calendar year | 1 January through 31 December of the current year |
| Last 12 months | Rolling period ending today |
| Free choice | A freely selected date range via the fields From and To, both days included |
For Season and Calendar year you step with the arrows next to the selection to the previous or next season or year without typing dates; preset and offset are part of the URL, so the view can be shared as a link. From and To fields only appear for Free choice. After entering dates manually, select Apply. The To date cannot precede the From date.
Comparison period
Below the period selection, Comparison defines what the tiles and the monthly trend are compared with:
| Selection | Effect |
|---|---|
| Previous year | Default: the equivalent period shifted back by one year |
| Previous period | The period of the same length directly before the evaluation period |
| Free choice | Your own comparison period via From and To, confirmed with Apply |
| No comparison | Hides the change values |
Projects whose figures are only recorded as totals cannot be assigned to a period and are therefore not part of the period comparison. The dashboard states their number below the tiles.
Budget export
Budget export in the header creates an Excel file with all budget rows of the projects that have events in the selected period; with an active Sage interface including the Sage actuals. The dialog is prefilled with the dashboard period. You can narrow down the rows:
- by Account number: type the beginning of the number into the field below Filter by account number (prefix match). Two buttons then show the number of matching rows in the first two budget columns (by default account and cost center). Only a click on one of them adds the input as a filter; it then appears as a chip “… starts with …” below the field. An input that is only typed does not filter,
- by Cost bearer: the selection limits the export to projects with these cost bearers. Without a selection all of them apply.
You can change the period in the dialog; without From and To, Export stays disabled.
Several filter values of the same column are combined with OR, filters of different columns with AND. With an active Sage interface, an additional option restricts the Sage bookings to the document date within the period. The export is house-wide and independent of your project access.
Where do the figures come from?
The dashboard combines information from all regular projects; project groups are not counted as separate productions. Sources include:
- visitors, sold tickets and revenue from the project BI component,
- project events, event types and assigned BI tags,
- room capacities and project-specific capacities,
- project categories or sectors,
- contracts, bookings, tasks, project documents and recorded effort ranges.
Business intelligence in a project explains how to maintain these details.
Results are only as complete as the source data
Missing figures are not automatically extrapolated in totals. Values that have not been recorded are shown as — so they are not confused with a real zero; productions without figures still pull totals towards zero. Use the data-gap notices and mark figures Not relevant in the project when they deliberately do not apply.
Recommended workflow
Last updated on